Overview of Network Service Applications

Overview of Network Service Applications

Network service applications include social driven, economy driven service and innovative technologies, covering a total of 11 service applications. When it comes to Network service applications, there are some related service and brands in Taiwan, but only few ones for innovative technologies.

Current Domestic Developments

Current Domestic Developments

Taiwan's IT technology comprehensiveness ranked among the top 25.

Taiwan's competitiveness performance ranked 15th in global rankings. Taiwan ranked 25th in terms of technology comprehensiveness in global competitiveness. Among the range of indicators in this sector, its best performance was the average allocated bandwidth to each Internet user, which ranked 6th in the world.

Key Indicators
Population (millions) 23.5
GDP (USD) $528.6
GDP per capita (USD) $22453.4
GDP (PPP) % world GDP 0.94
Index Compnent Rank/137 Score
Global Competitiveness Index 15 5.3
Technology readiness 25 5.7
1. Availability of latest technologies 30 5.6
2. Firm-level technology absorption 29 5.2
3. FDI and technology transfer 35 4.9
4. Internet users % pop. 30 79.7
5. Fixed-broadband Internet subscriptions /100 40 24.2
6. Internet bandwidth kb/s/user 6 717.6
7. Mobile-broadband subscriptions /100 pop. 29 90.8

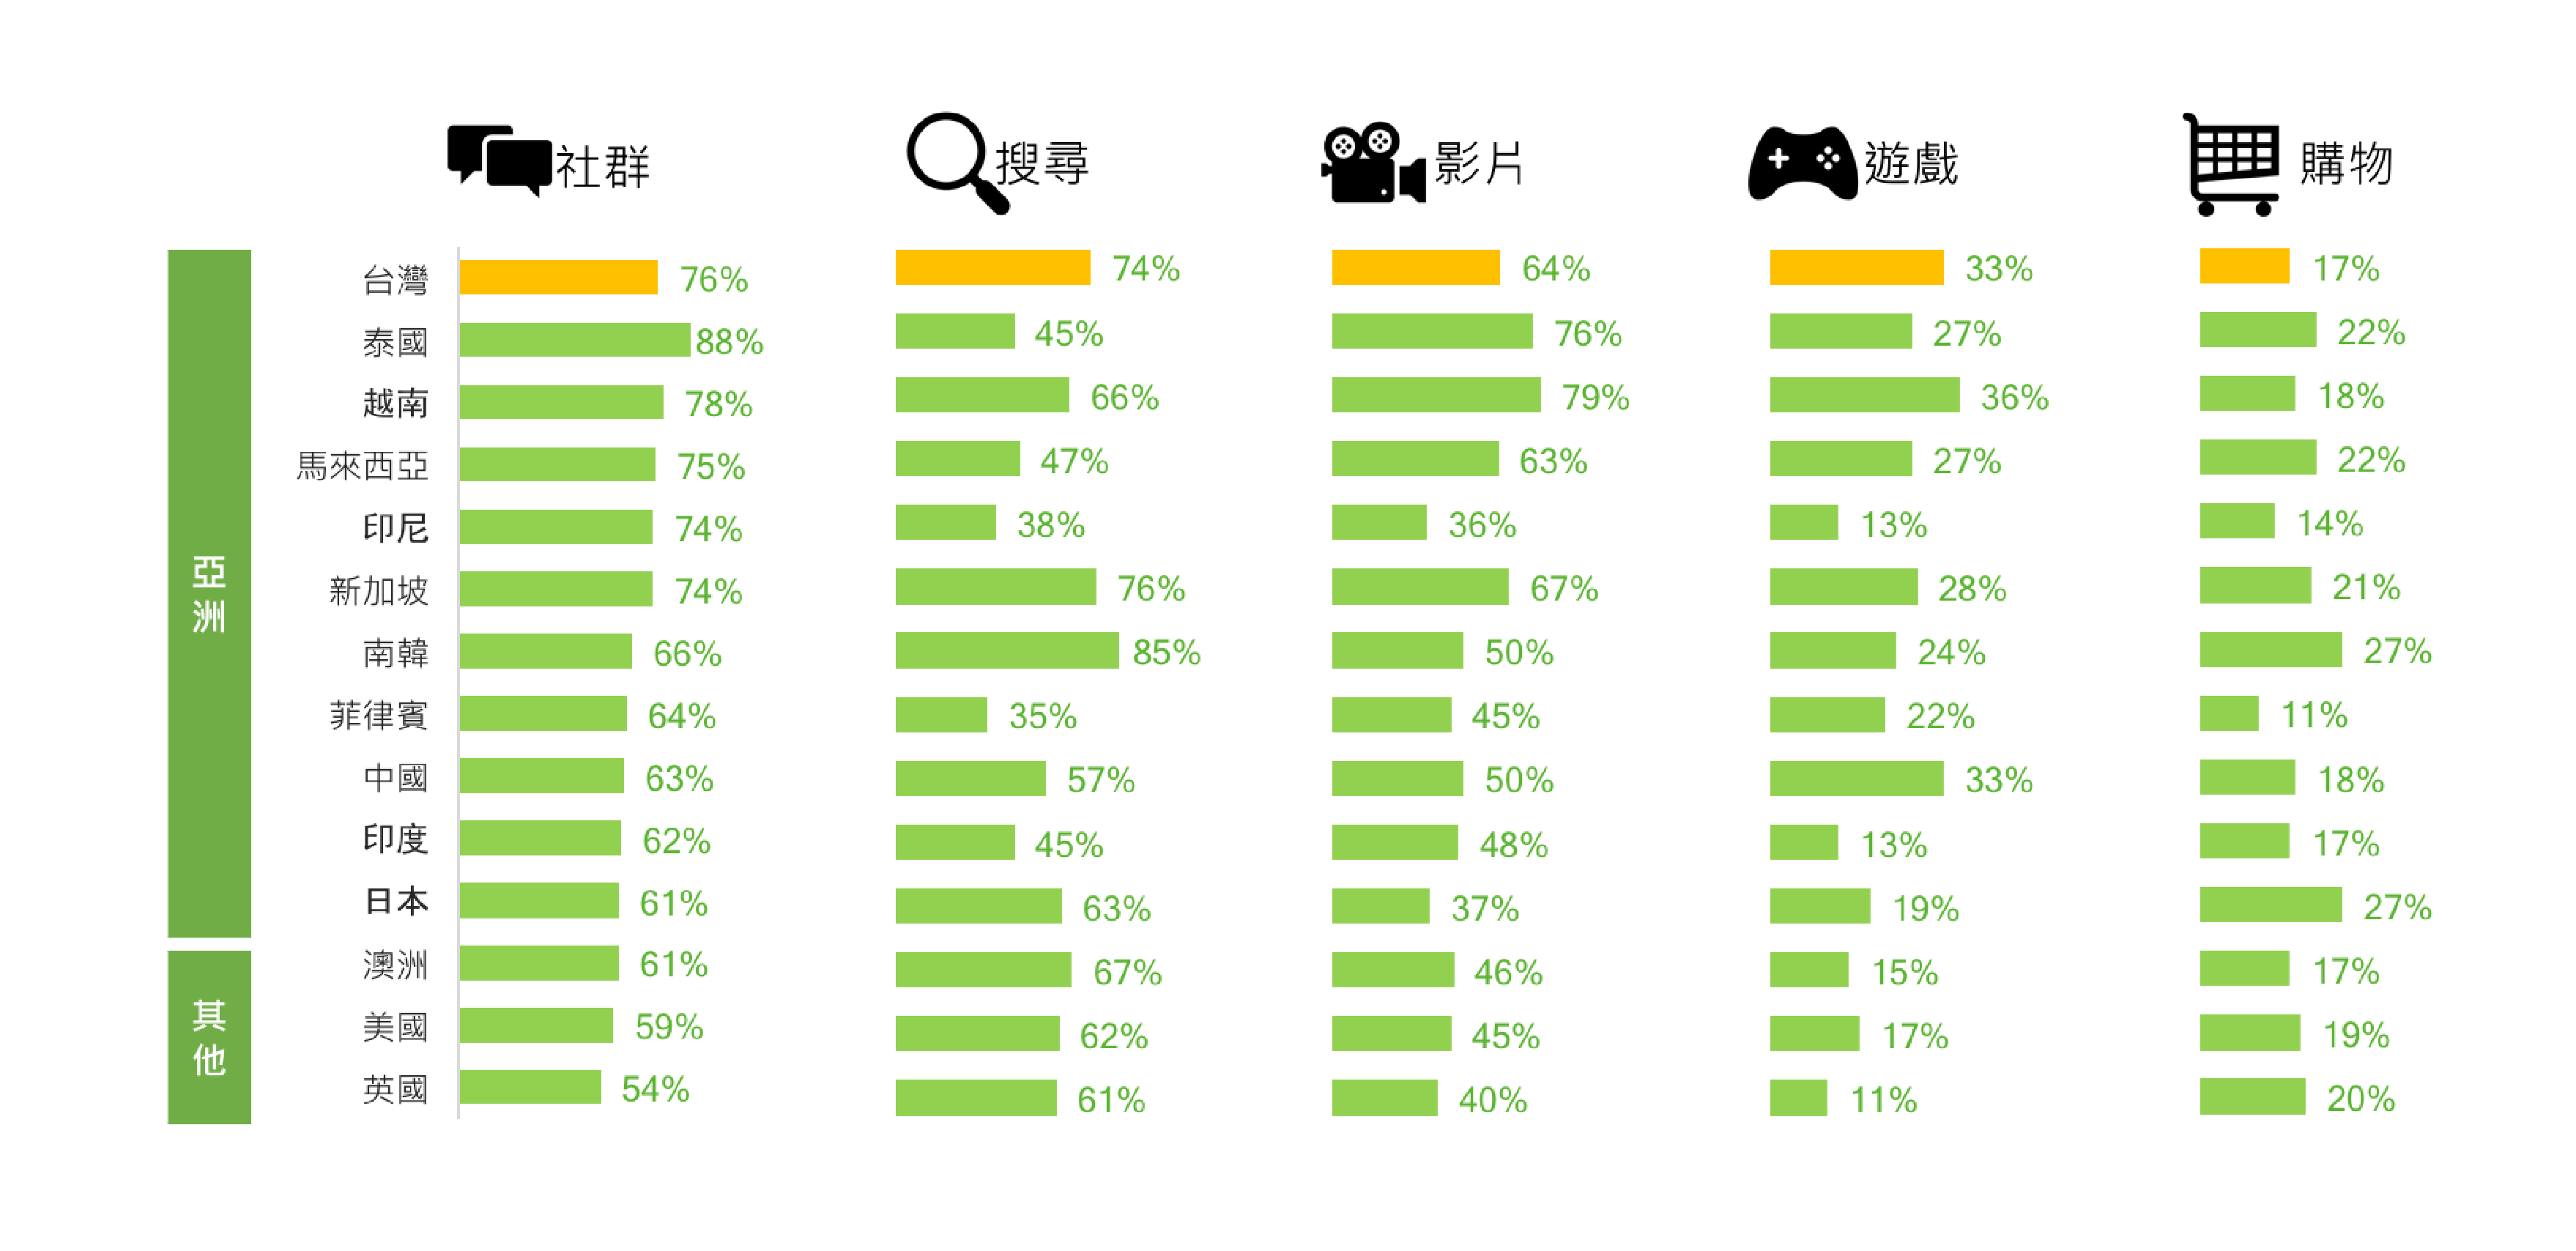
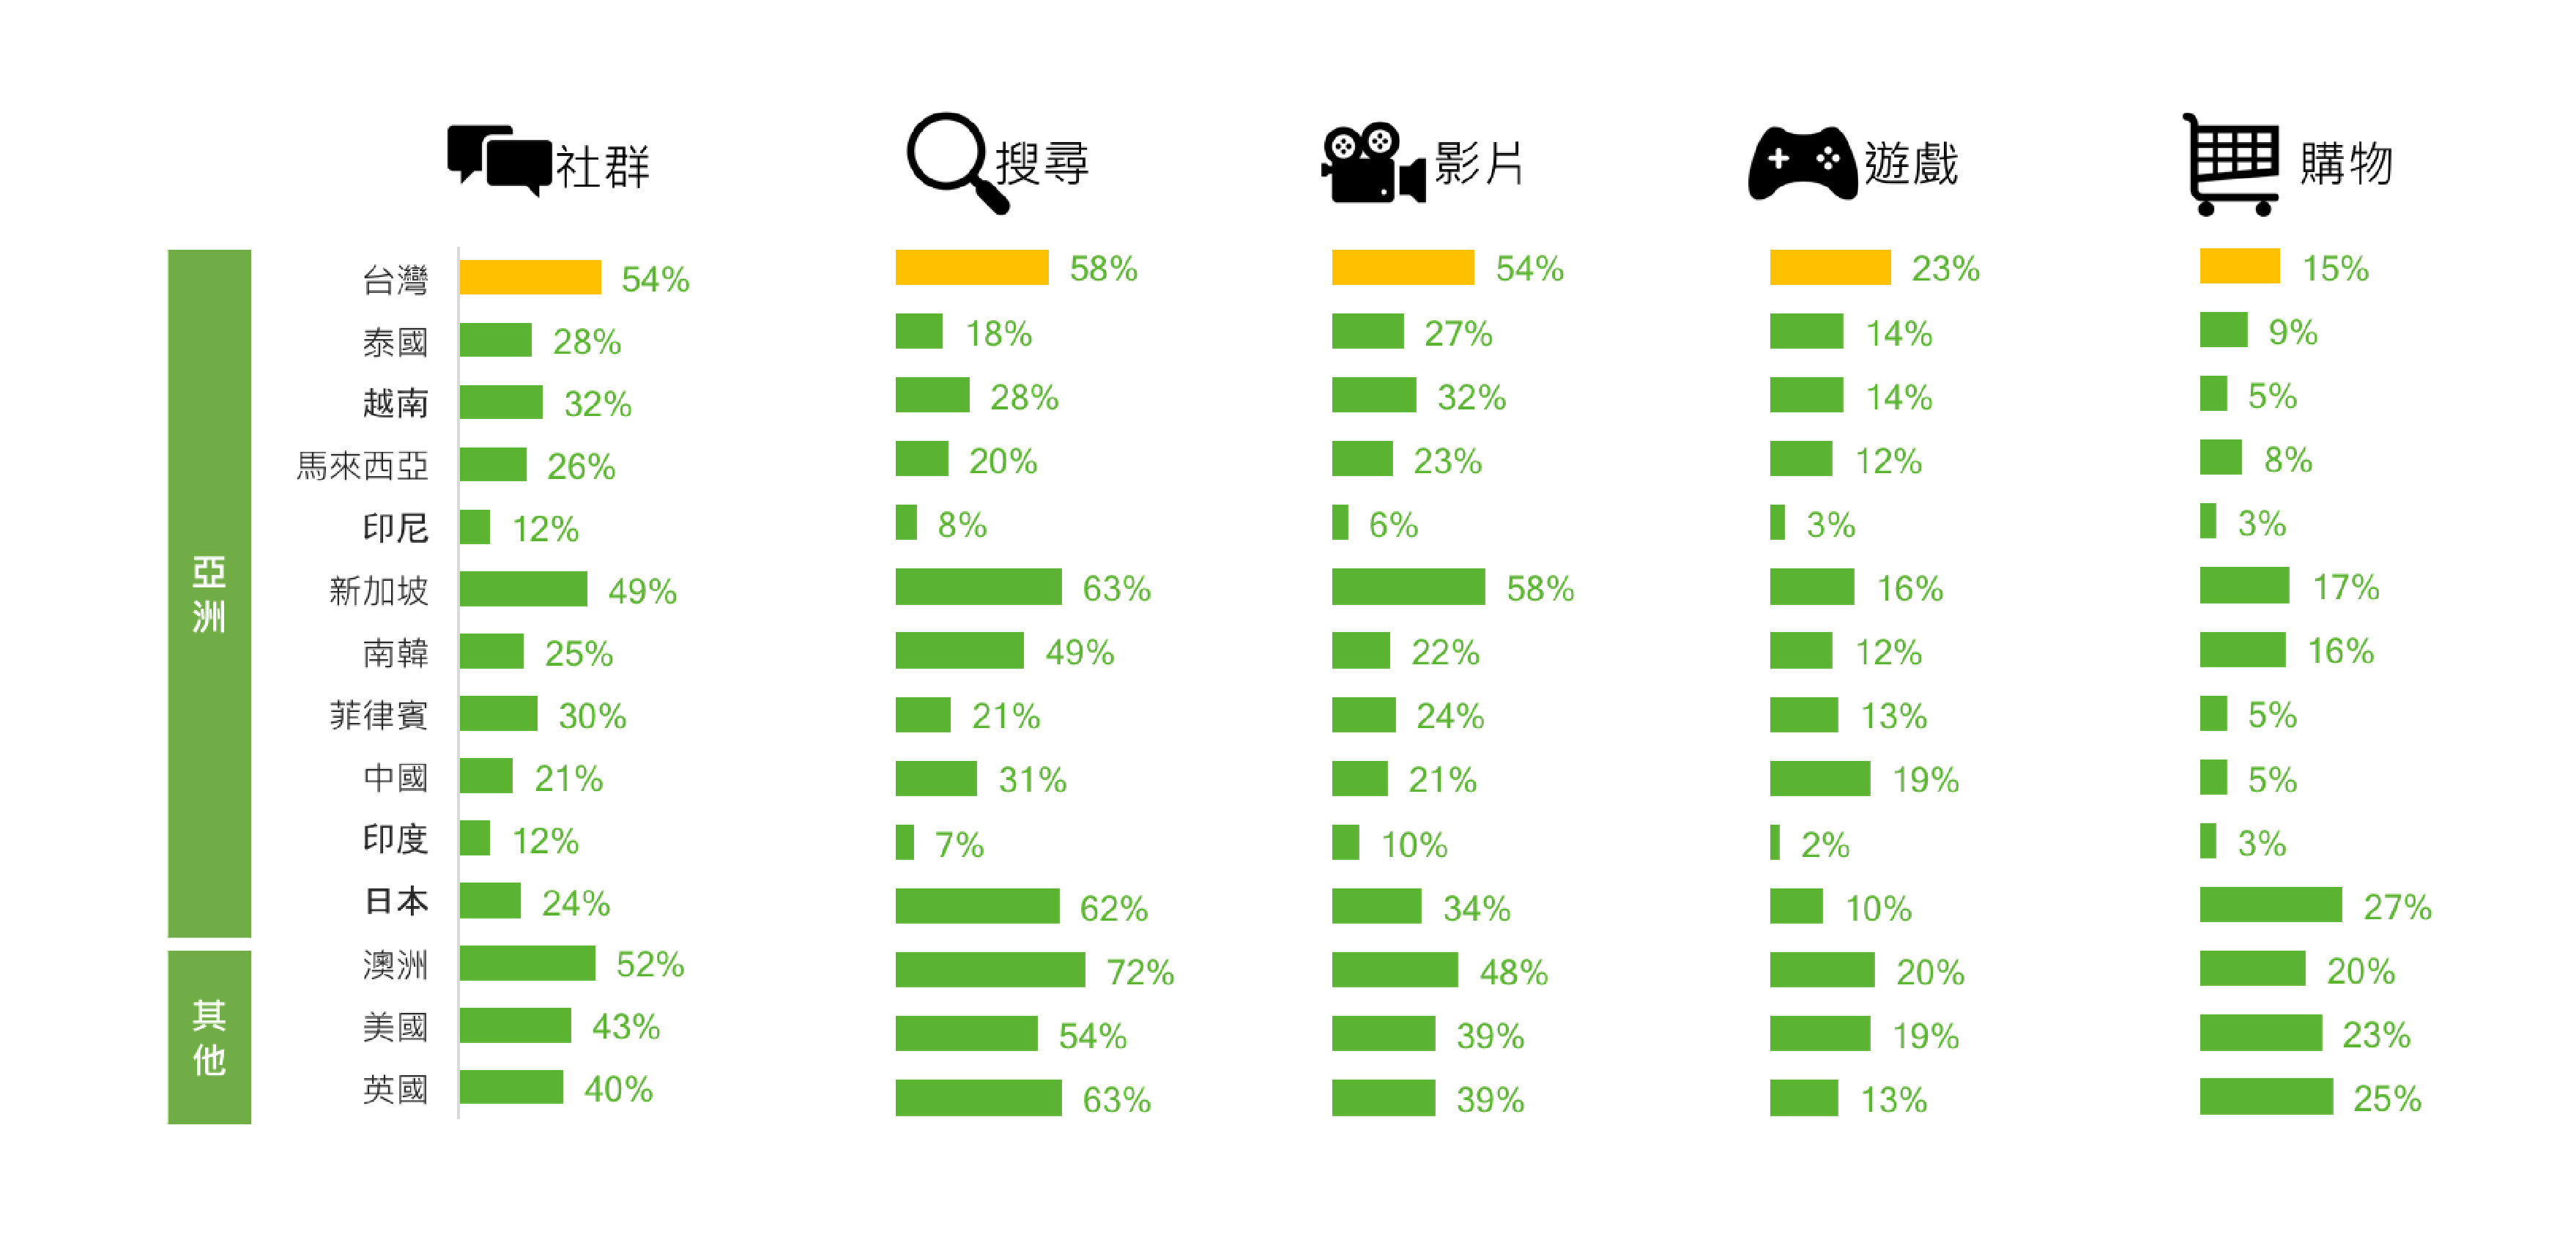
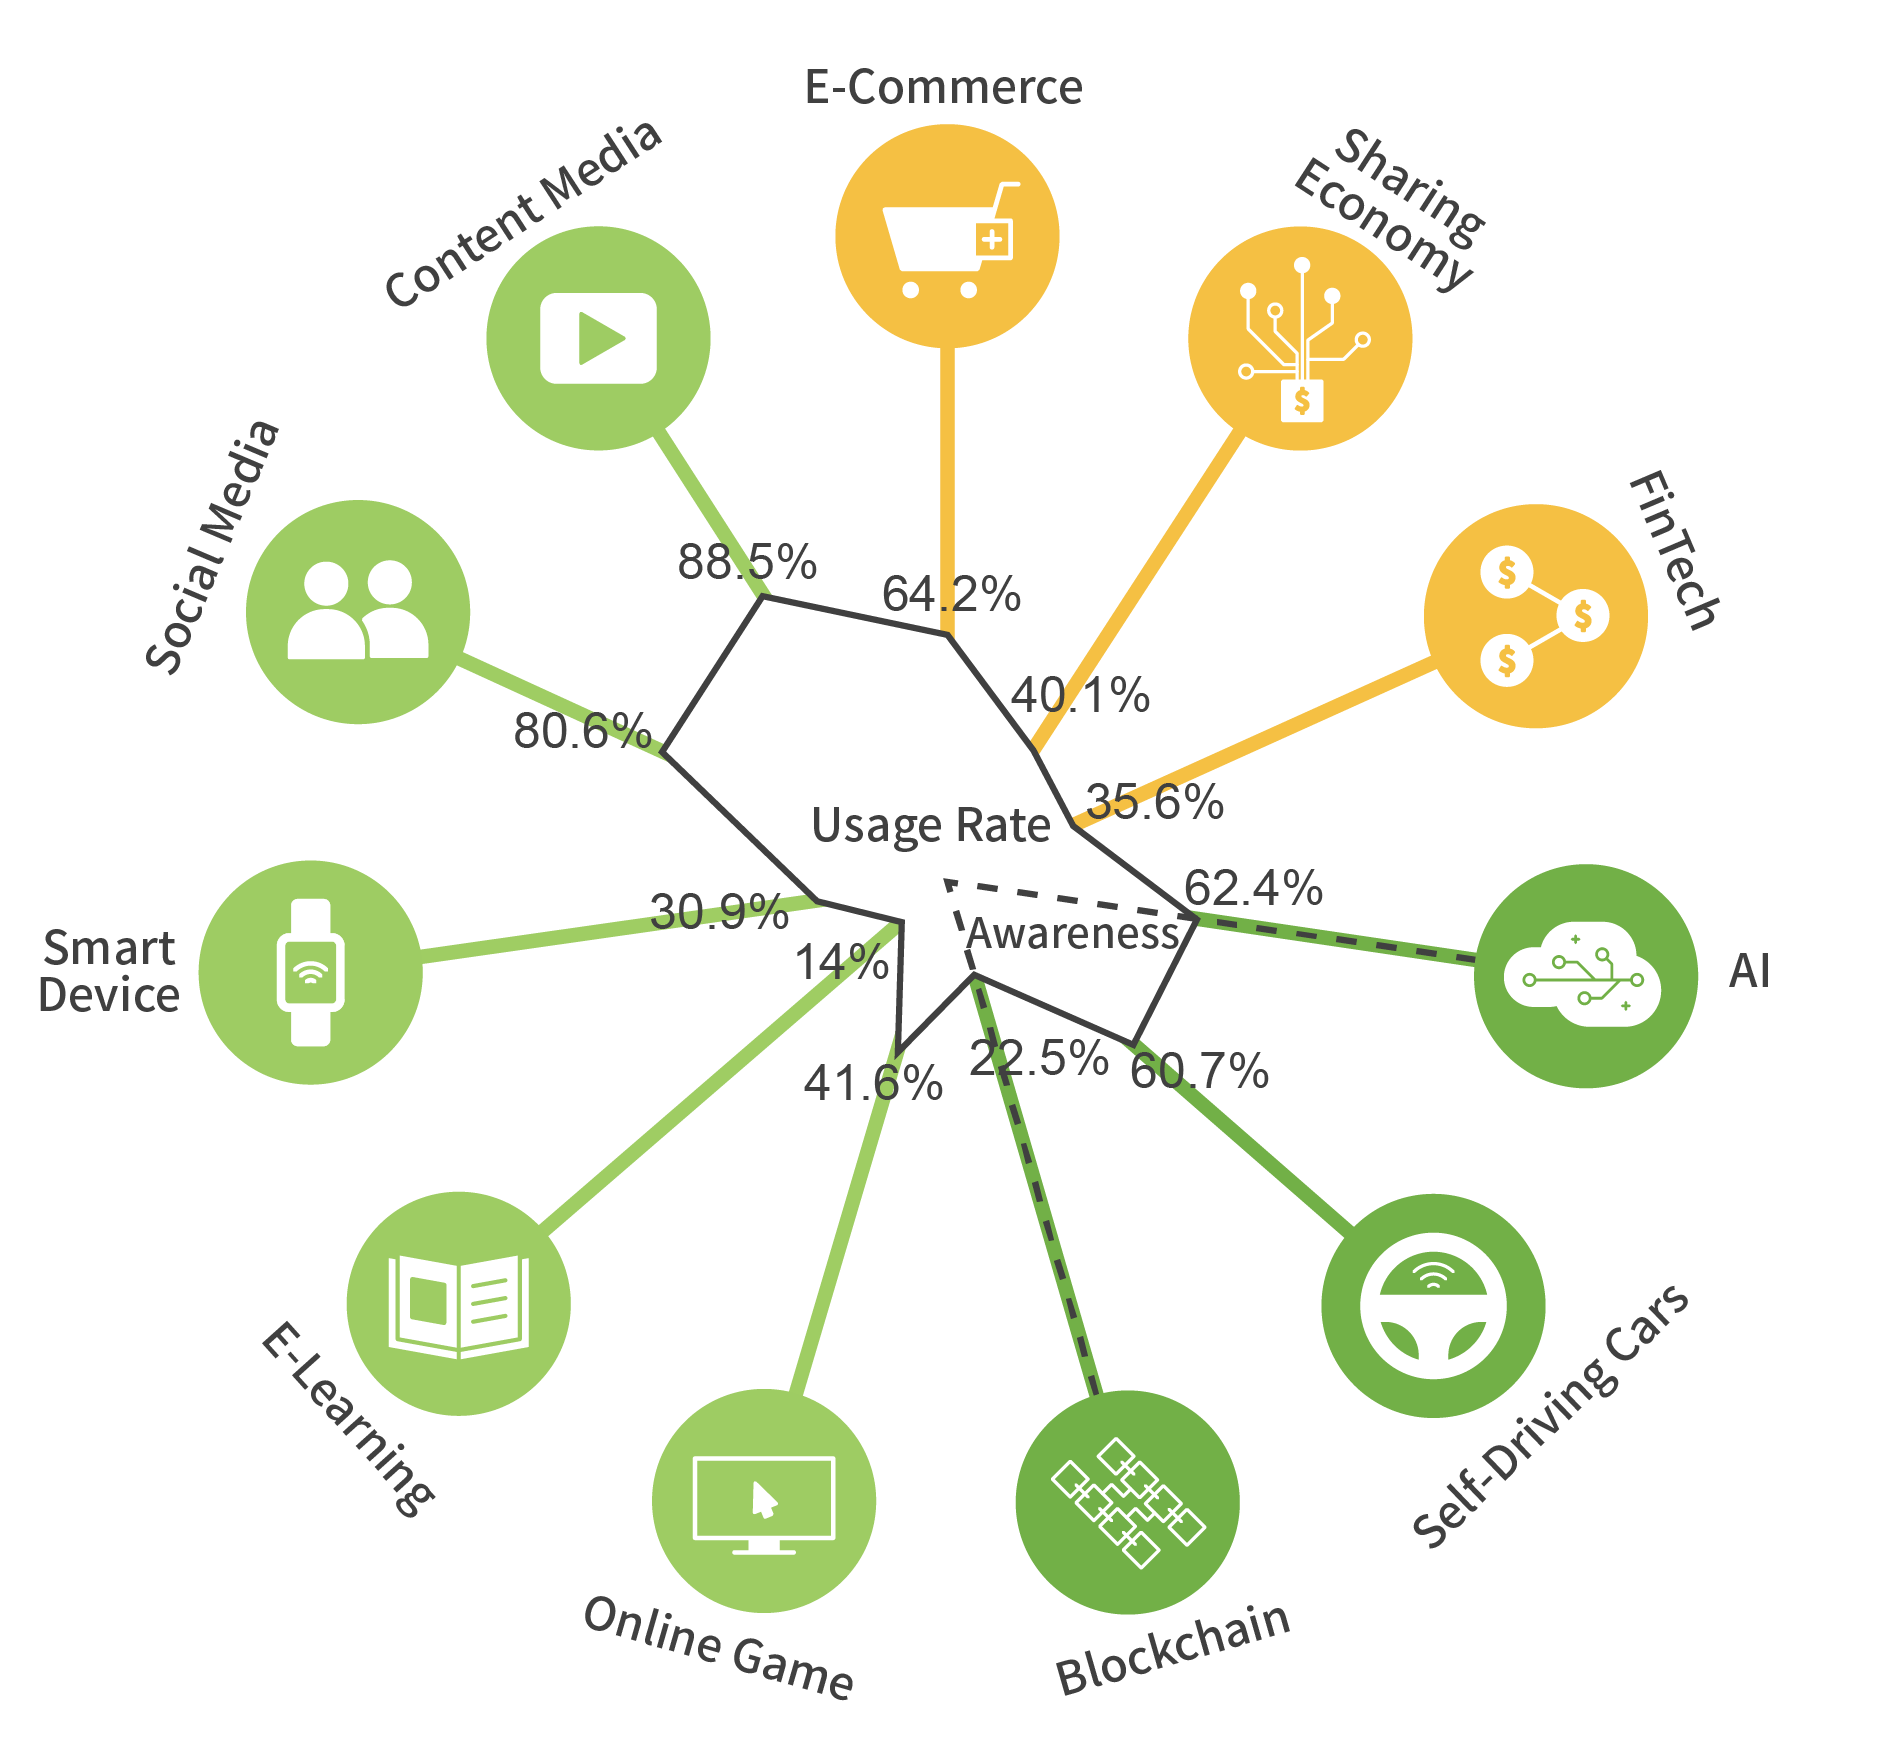
Comparison of Network Service Applications

Related applications and brands have been developed for domestic Internet services and applications. The usage rates for content and social media are the highest, and they are followed by e-commerce. There are fewer applications of innovative Internet concepts, and the market has yet to mature. In terms of familiarity with terms, performance in artificial intelligence has been higher.

Top Players for Key Verticals

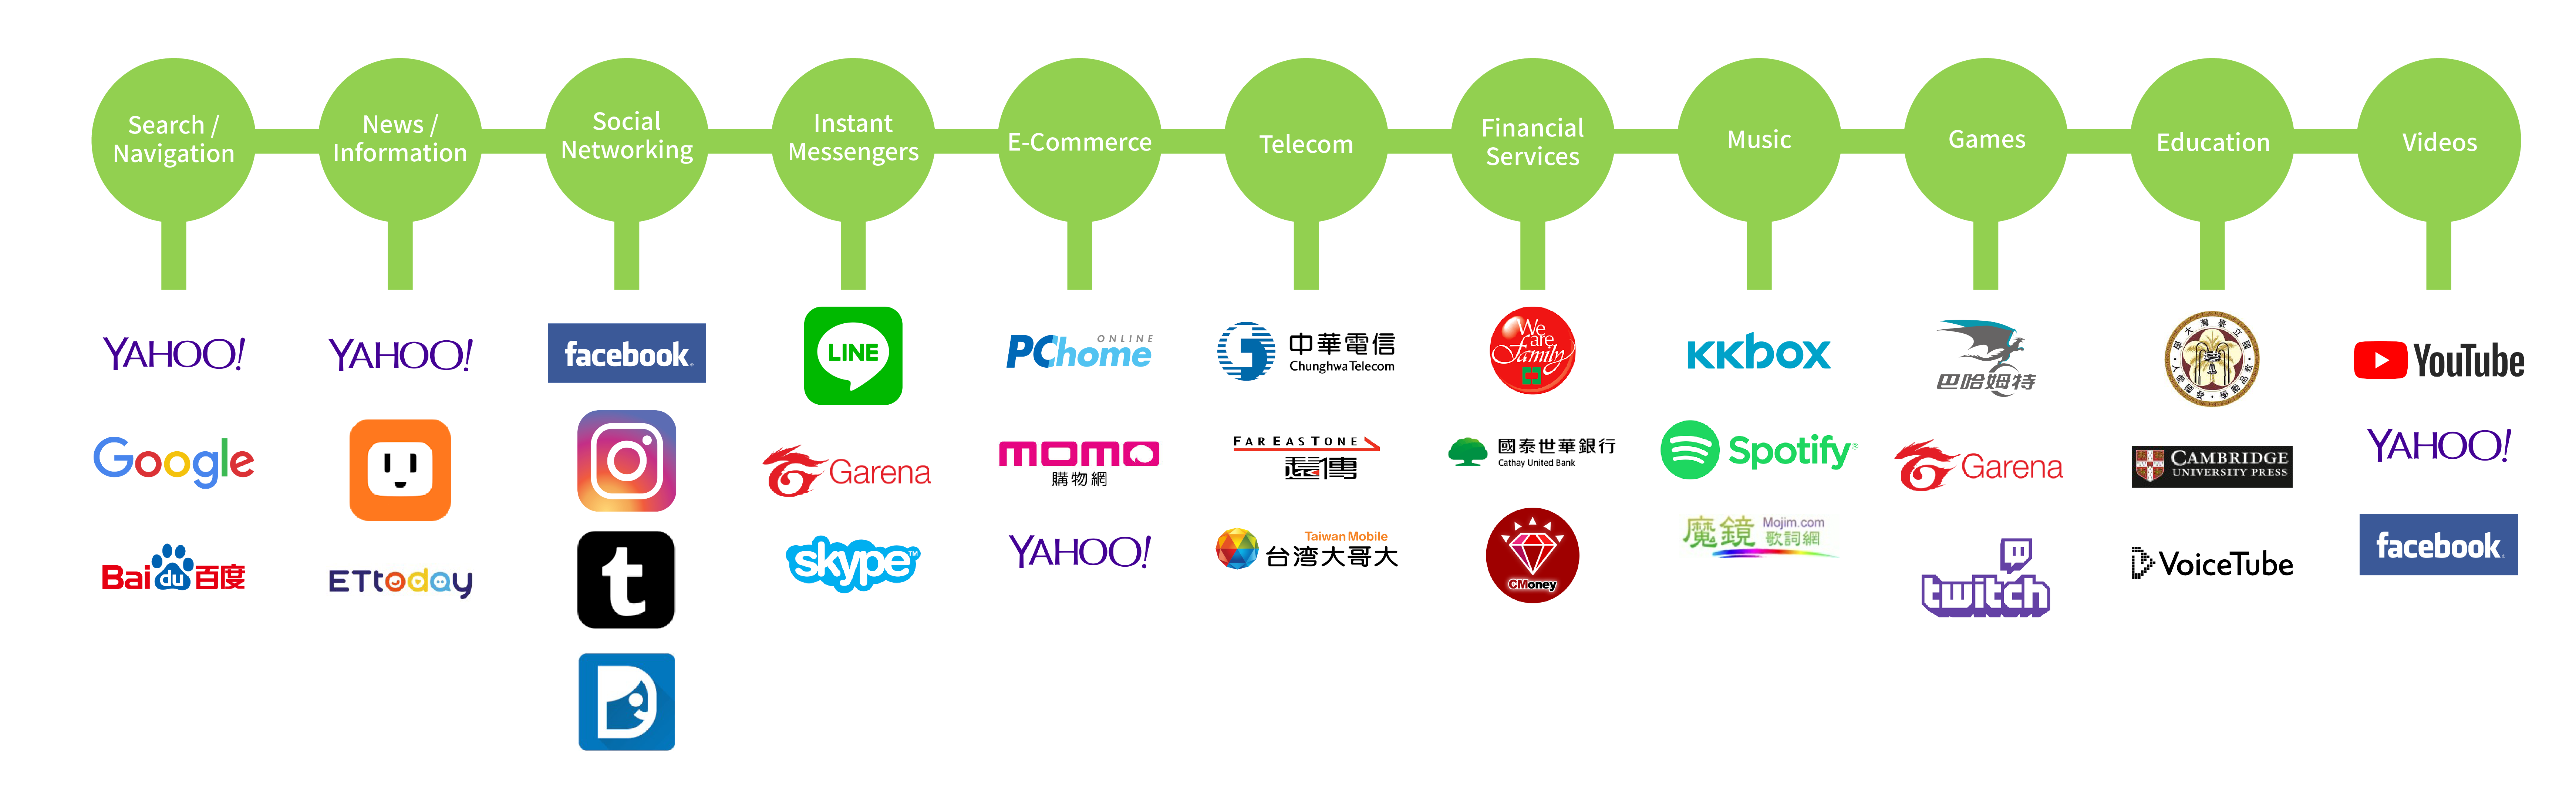
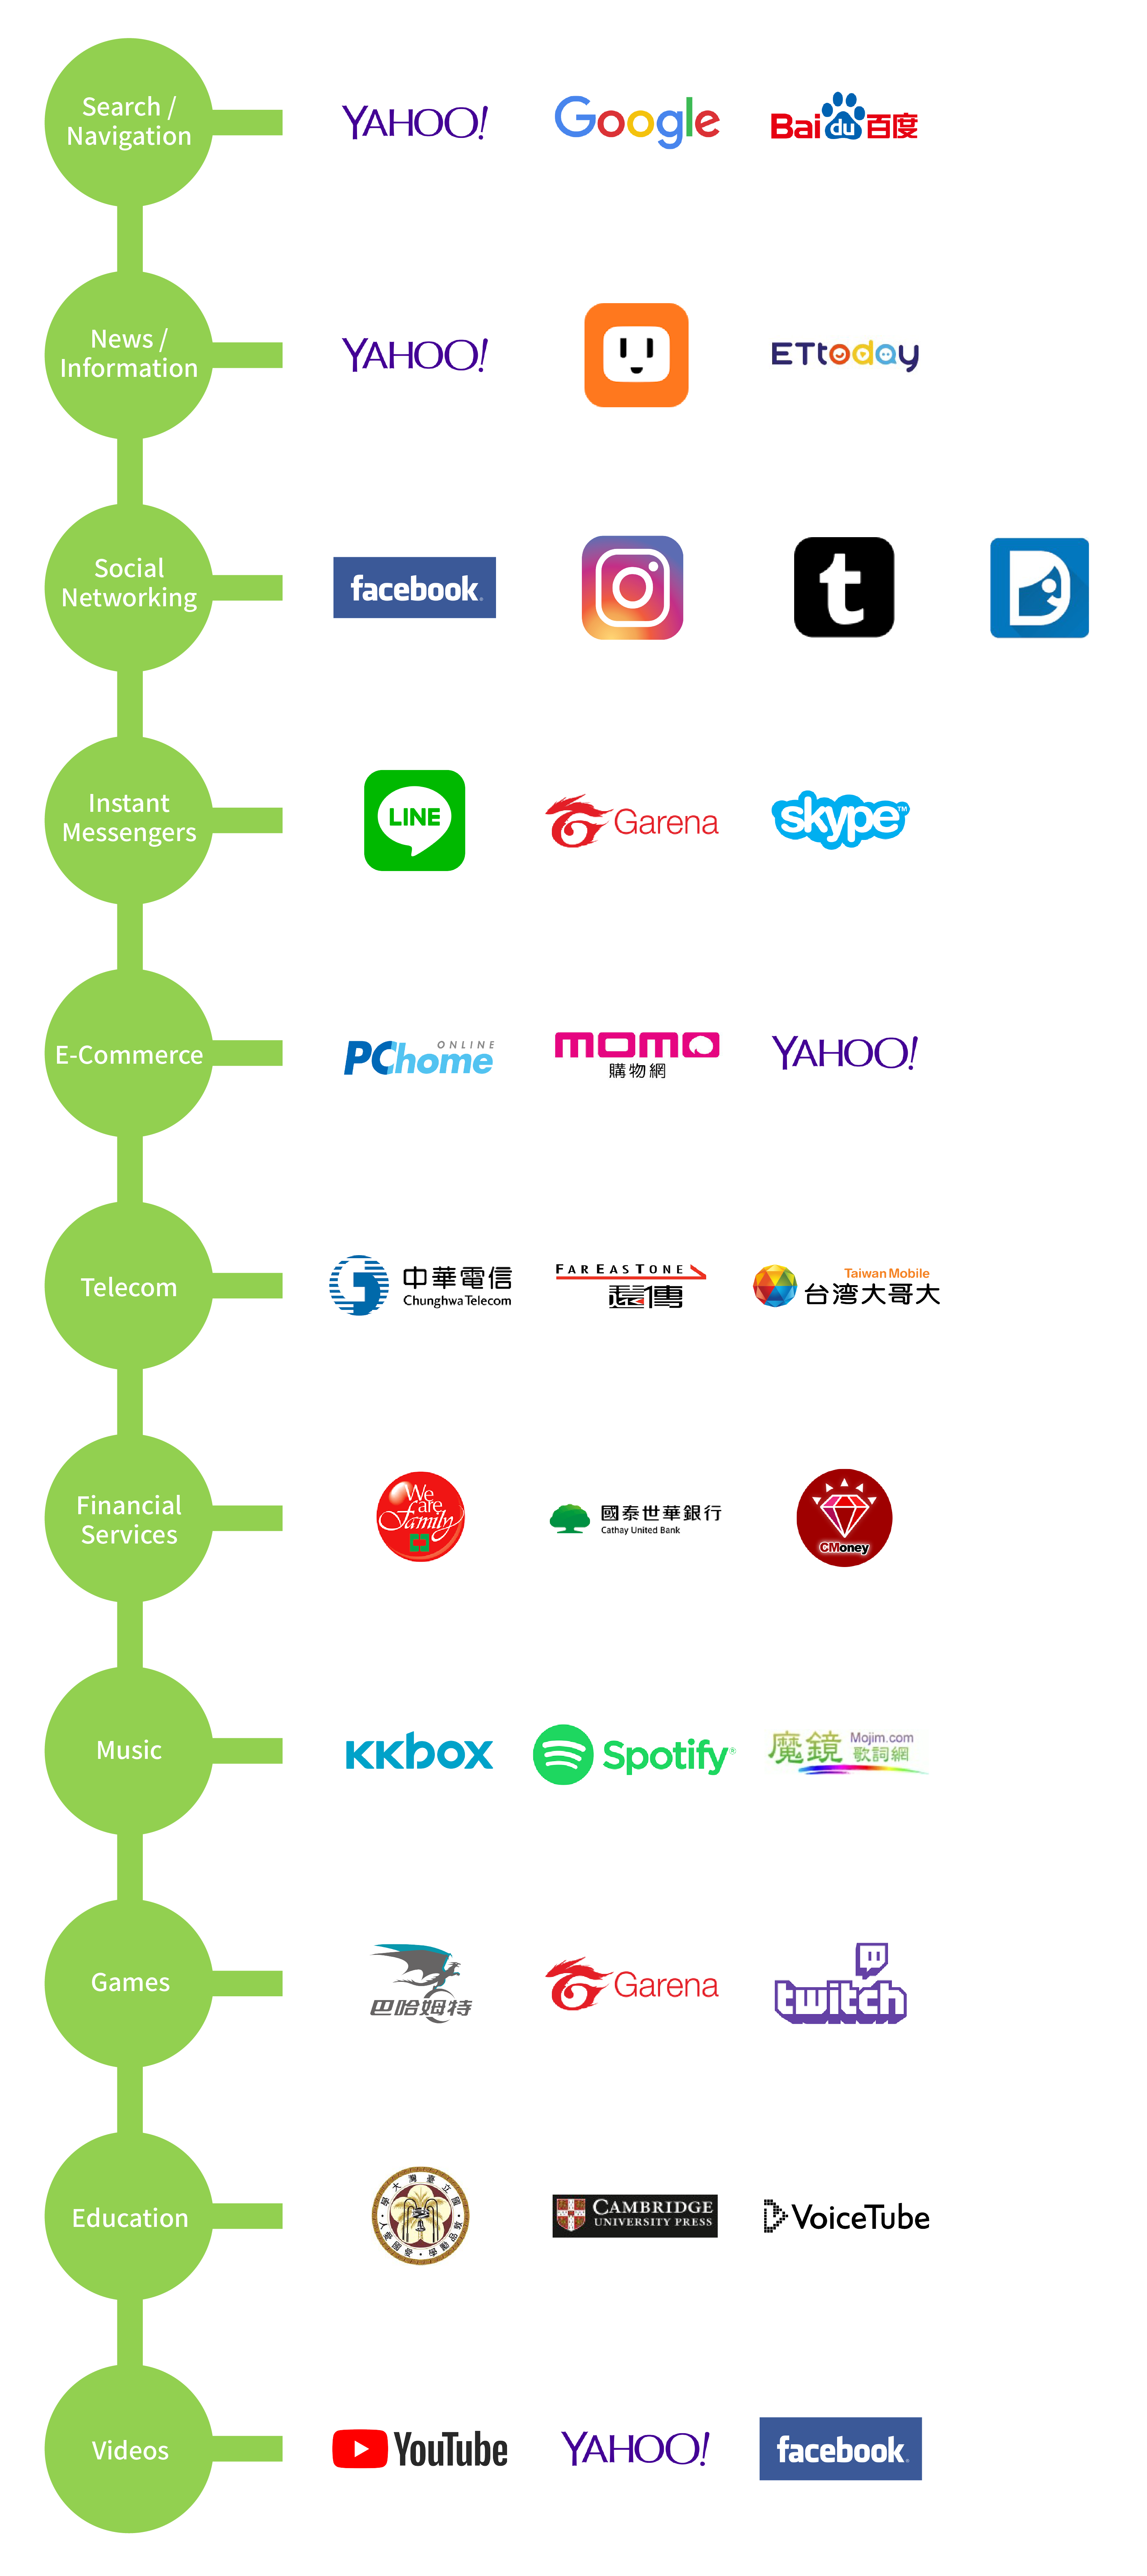
  • Sites and brands rank by total unique visitor from Comscore MMX, Top 100 Properties, Total Audience, Oct 2018, Taiwan with re-editing.
  • Source: information compiled by InsightXplorer

Comparison of Current Developments in Other Countries

Comparison of Current Developments in Other Countries

The social media usage rate tops the rankings in most countries and usage on desktop computers/laptop computers remains lower than usage on mobile phones. Based on the online access behavior of mobile phones in different countries, Taiwan ranks third in terms of social media usage and the search usage rate is relatively high, trailing only South Korea and Singapore. It ranked fourth in video browsing rate, slightly behind Vietnam, Thailand, and Singapore. It ranked second with China in terms of game usage rate. Online shopping usage rate in other countries is approximately 20%.

Online behaviors Comparison

Visiting social networks get highest use rate in most countries. Fewer online behaviors on desktop/laptop than mobile.

  • Because the survey method, classification and the fieldwork period of the data source are different from this survey, please reference the usage rates announced in this survey. Please reference the country rankings in this chart.
  • Source: Consumer Barometer with Google(2017)

Devices Used to Shop online

The main devices used for online shopping are desktop or laptop computers. Taiwan's online shopping usage rate for desktop/laptop computers ranked second, slightly lower than that of Japan.

Country Devices Usage Rate
Taiwan Desktop/Laptop 85%
Smartphone 10%
Tablet 3%
Japan Desktop/Laptop 92%
Smartphone 6%
Tablet 1%
Singapore Desktop/Laptop 74%
Smartphone 18%
Tablet 5%
Malaysia Desktop/Laptop 72%
Smartphone 20%
Tablet 6%
Vietnam Desktop/Laptop 71%
Smartphone 18%
Tablet 4%
S. Korea Desktop/Laptop 70%
Smartphone 25%
Tablet 2%
China Desktop/Laptop 70%
Smartphone 21%
Tablet 4%
Philippines Desktop/Laptop 66%
Smartphone 23%
Tablet 4%
India Desktop/Laptop 60%
Smartphone 34%
Tablet 1%
Thailand Desktop/Laptop 57%
Smartphone 31%
Tablet 4%
Indonesia Desktop/Laptop 29%
Smartphone 67%
Tablet 1%
United States Desktop/Laptop 81%
Smartphone 10%
Tablet 6%
United Kingdom Desktop/Laptop 81%
Smartphone 7%
Tablet 9%
Australia Desktop/Laptop 80%
Smartphone 10%
Tablet 7%
  • 1. This dataset is from single select question, since there are other devices and reject to answer, the total percentage may not equal to 100%.
  • 2. Because the survey method, classification and the fieldwork period of the data source are different from this survey, please reference the usage rates announced in this survey. Please reference the country rankings in this chart.
  • Source: Consumer Barometer with Google(2017)

Frequency of watching online videos

Most online videos users are watching daily.

  • Because the survey method, classification and the fieldwork period of the data source are different from this survey, please reference the usage rates announced in this survey. Please reference the country rankings in this chart.
  • Source: Consumer Barometer with Google(2017)

Wearables Ownership Ranks

Malaysia is the country with the highest ownership rate of wearable devices in Asia, while the United States has the highest ownership rate overall.

Area Country Rank
Asia Taiwan 6
Malaysia 2
China 4
Singapore 5
S. Korea 6
Philippines 7
India 8
Japan 9
Indonesia 10
Vietnam 10
Thailand 11
Others United States 1
Australia 2
United Kingdom 3

Copyright © 2019 Taiwan Network Information Center